“With the data, we can look at ridership – not only by route, but we can look at it by hour of the day and by stop – and we can target areas that we can cut that won’t be so painful for our customers.”
Jon Sullivan
Transit Planner, RVTD
Rogue Valley Transit District (RVTD) is an award-winning public agency based in Medford, Oregon that provides fixed route service to seven communities in Jackson County. The agency has 26 fixed route buses that they run on 8 routes.
In June 2017, RVTD was presented with the CTAA award for Urban Community Transportation System of the Year. Among other criteria, the award recognizes agencies for “being responsive to its customers’ and community needs”. Jon Sullivan, Transit Planner at RVTD, feels that their use of fixed route software has been key to their customer service success.
Knowing Where to Cut Service
In 2014, RVTD determined they would need to cut service if they could not procure more funding and in an effort to do so, proposed a property tax levy. However, the proposal did not get passed, and as a result RVTD needed to make some ‘tough’ routing decisions. Stop-level data from Streets ITS and APCs made it easier for RVTD to make these tough decisions. The data enabled RVTD to see where they could shorten and streamline routes to improve efficiency, while minimally impacting riders.
“With the data, we can look at ridership – not only by route, but we can look at it by hour of the day and by stop – and we can target areas that we can cut that won’t be so painful for our customers.”
Using stop-level ridership data, RVTD decided to cut service to the airport because they found that less than 3 people were boarding or alighting at the stop on an average day. Removing the airport stop shortened the route from 45 minutes to 30 minutes. This was “huge” because it enabled RVTD to fit in another half an hour of work for that driver.
“Removing service to the airport was a key cut that enabled us to save a significant amount of service elsewhere where people were actually using it.”
This bubble map uses Streets data to show boarding and alighting data for each stop along a route. The map allows planners to see how they may consolidate stops to accommodate riders and maintain efficiency.
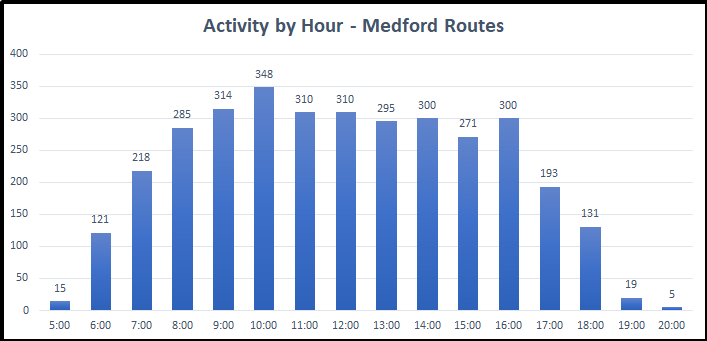
This graph uses Streets data to show passenger activity by hour for selected routes. With this information, RVTD can make intelligent decisions about hours of service and frequency of service.
Knowing Where to Adjust Service
In 2016, RVTD put forth a property tax levy again. This time, the community got behind the motion and it passed. This meant extra operating revenue and an opportunity to improve service.
RVTD wasn’t going to take its additional funding for granted and make wasteful decisions. They wanted to make service improvements in the most efficient way possible.
“You can say ‘we’ll just increase all the service on all the routes for all the hours of the day’, but then you’re wasting precious operating dollars on service that people are probably not going to use.”
Front Street Station in Medford is a transit hub where the district’s 8 routes intersect. If a bus arrives at the station late, riders may miss their scheduled connection. Using time-point level route-schedule adherence data, Jon discovered that on route 60, riders were often missing their scheduled connection because the bus was too late arriving to the station.
Using passenger activity data, RVTD made small changes to the route pattern. They modified the route to bypass a residential neighborhood and also consolidated some stops. These actions enabled the bus to consistently arrive at the station 2 minutes earlier, and as a result far fewer people now miss their connections.
Instead of lengthening the time allotted to perform the route, we were able to make some micro-adjustments to save resources.
RVTD is proof that it doesn’t take tons of cold hard cash to provide excellent service and “be responsive to customer needs”. Though the district is fortunately receiving additional funding through the property tax levy, they are being careful about how they spend their funding. Their fixed route software enables RVTD to make intelligent, data driven decisions.
“Having data allows you to make targeted cuts and expansions that are going to better serve your customers and save your agency money.”
Congratulations to RVTD for making the most of their software’s reporting capabilities, and being named the CTAA’s 2017 Urban Community Transportation System of the Year!