Attractive and Dynamic Reporting, Made Easy
Providing accurate reports drawn from dependable data collection sources is key to a ridesharing operation. However, with our reporting solution, you’ll be able to do a whole lot more with all that data. Browser-based and easy-to-use, our dashboard system for viewing, filtering and manipulating data will make your reports the envy of any agency. With little to no IT experience, any user will be able to distill the information you require and create dynamic and attractive reports.

Dashboarding and Dynamic Filtering
All the power of traditional reporting methods but with the ability to display data in unique ways. Drag-and-drop widgets allow you to customize your dashboard view. Then, working with your data is easy and intuitive. Rearrange data with a few clicks and your reports update automatically.
- Easily edit a filter to focus on the data you want
- Add, remove or move widgets to put data where you want it
- Map views give you better insight into user information
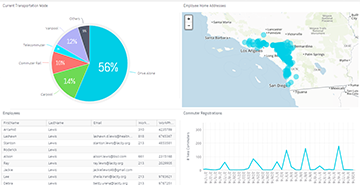
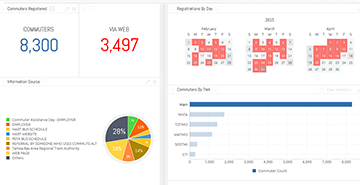
Chart Wizardry
Display your data in a variety of formats: pie charts, bar graphs, GIS accurate maps, you name it. With a touch of a button, you can create visually stunning presentations in no time. Then, it’s a simple matter to share your reports to impress all stakeholders.
- Quickly export reports for sharing in popular formats: PDF, DOC, etc.
- View data as a spreadsheet as well as in chart form
- Editing data sets updates charts immediately
Customizable and Accessible
Everyone can have their own unique view of the information in your database. Dashboards allow widgets to be placed based on the individual preferences so each can work more effectively. Because the system is browser-based, everyone can have access to this data from any web-enabled device.
- View or update reports from home or in the office
- Updated reports are backed up and safe
- Present your data to stakeholders anywhere you are
RidePro Reporting & Dashboarding
From an easy-to-use dashboard, you have a clear and concise view of your data. With a few clicks, users of almost any technical ability can build reports, adjust filtering properties and display data in a variety of graphical formats. Your staff will appreciate having the power of dashboarding:
- Drag-and-drop widgets for custom set-up
- Unique view for each user
- Quick export to share visually stunning reports