Useful Tools for the Transit Trade (Ridership Trends)


The American Public Transit Association (APTA) has some cool new resources for the entire transit industry. Transit agencies and businesses can now follow current ridership trends and see how agencies stack up against their peers. In response to the many public health alerts across the country over the past year, transit ridership has fallen and risen at lightning speed. As a result, traditional monthly and quarterly ridership reports no longer hold much value, and many agencies have gotten whiplash trying to predict their ridership volumes.
Tracking Changes in Ridership
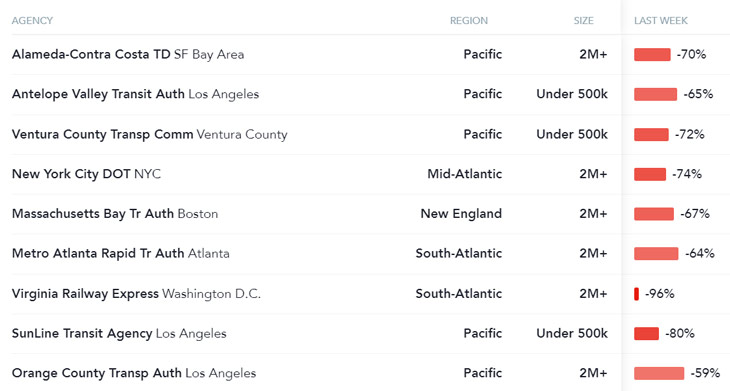
Now more than ever before, the demand for useful ridership data is critical. To tackle this very real challenge, agencies are turning to some amazing new tracking tools by APTA like the Estimated Change in Ridership dashboard that can be used to compare changes in demand for transit across different places, sorting by individual agency, region, and agency size.
How Does it Work?
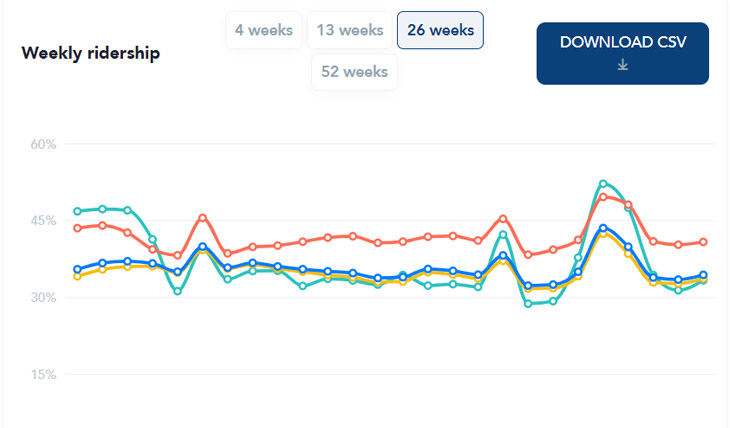
Estimated values for each week are statistically modelled based on measures of transit app usage. All-in-all, this tracking tool is a great, intuitive guide for agencies however it comes with some drawbacks. It does not provide real-time information and nothing can replace hard, cold numbers that can be collected by a CAD/AVL solution like TripSpark's Streets Fixed Route Software suite.
Data drill-down
APTA has another useful data-management tool that provides specific stats by agency, region, and agency size. This adjustable chart looks at both relative change and absolute numbers.
How do APTA Ridership Trends Work?
There's a lot of data collection and collaboration that goes into creating a tool like this. High-level, here's how it works:
- It combines anonymous, recent data on app usage from Transit's mobile application with actual ridership numbers reported by agencies
- It examines the relationship between its sources both pre and post-pandemic to calibrate Transit app usage to APTA's quarterly ridership reporting
- It shows app usage and ridership by agency, with change over time
- It updates ridership data on a weekly basis
Who Wants to Know?
The transit industry has started to embrace this great resource in conjunction with other useful data collected by transit agencies, to help them meet the needs of their riders and improve operations. Best of all, the information is useful for the entire industry, including:
- Agencies trying to understand if their local ridership volumes are comparable with their peers, especially as the pandemic vaccine rolls out across the county
- Transit-related businesses wanting current industry trends to better pair their products and services
- Media outlets reporting on what's happening in the transit industry
- Policymakers at the state and federal level, who are seeking current public transporation ridership information
With the massive amount of data that is collected or can be collected, the new APTA dashboard is just one shining example of how this information can be harnessed to provide valuable insights for the transit industry.